


U.S. Hotel Occupancy Continues To Slowly Rise
June 25, 2020
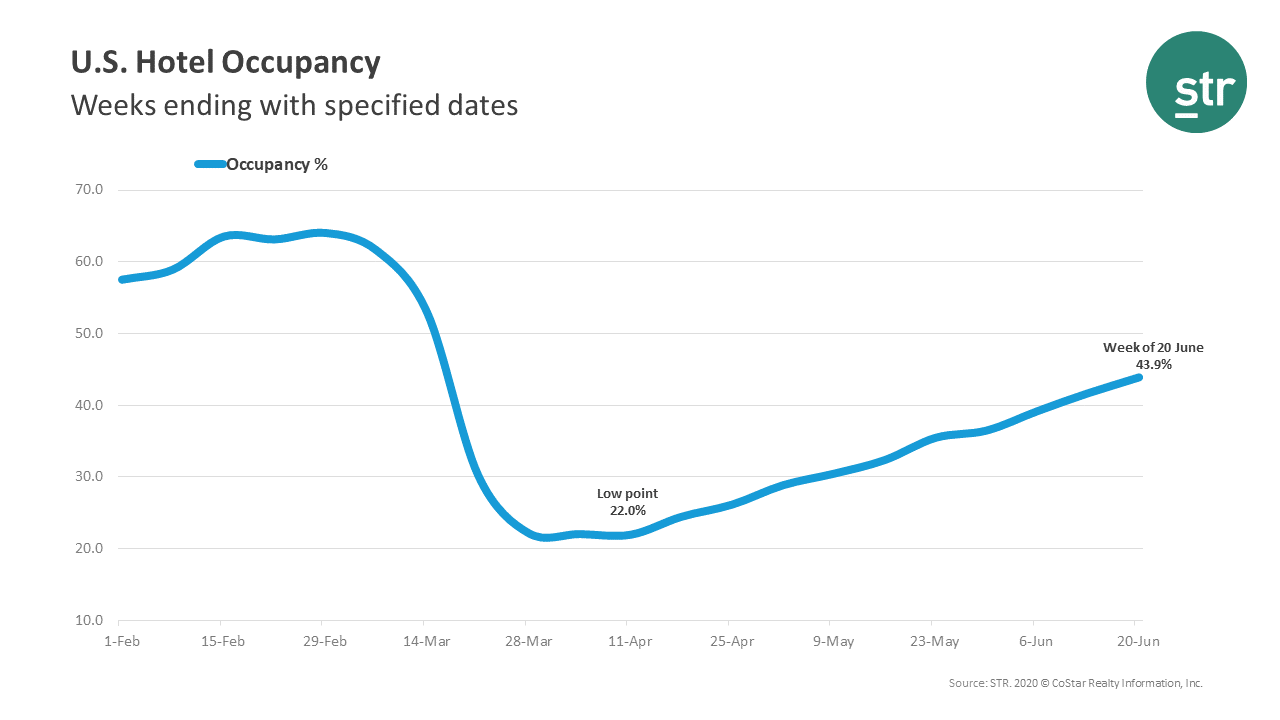
U.S. hotel performance data for the week ending 20 June showed another small rise from previous weeks and less severe year-over-year declines, according to STR.
14-20 June 2020 (percentage change from comparable week in 2019):
- Occupancy: 43.9% (-41.8%)
- Average daily rate (ADR): US$92.20 (-31.7%)
- Revenue per available room (RevPAR): US$40.48 (-60.3%)
“Occupancy was up another couple percentage points from last week, marking the 10th consecutive week of such an increase,” said Jan Freitag, STR’s senior VP of lodging insights. “Demand continues to be pushed upward by drive-to spots and the destinations with outdoor offerings such as beaches. For the week, 10 submarkets showed occupancy above 70%, led by Panama City (88.7%), where occupancy was just 0.7% lower than the comparable week in 2019.”
Aggregate data for the Top 25 Markets showed lower occupancy (38.4%) than the national average, but slightly higher ADR (US$93.40).
Norfolk/Virginia Beach, Virginia, was the only one of those major markets to reach a 50% occupancy level (54.0%).
The next highest occupancy levels were registered in Tampa/St. Petersburg, Florida (49.4%); Phoenix, Arizona (48.3%); and Detroit, Michigan (46.2%).
Markets with the lowest occupancy levels for the week included Oahu Island, Hawaii (13.7%); Boston, Massachusetts (26.1%); and Orlando, Florida (28.2%)
Of note, in New York, New York, occupancy was 43.6%, down from 45.7% the week prior. In Seattle, Washington, occupancy was 33.2%, up slightly from 31.5% during the previous week.
Additional Performance Data
STR’s world-leading hotel performance sample comprises 68,000 properties and 9.1 million rooms around the globe. Members of the media should refer to the contacts listed below for additional data requests.